This post describes the works I have done during the first week of “coding period” of my Google Summer of Code 2017 project.
This week I have created a proof of concept web application which demonstrate custom indoor mapping using Google Maps API. I have used the GeoJSON format for encoding the various geographic data which represent different features such as ‘room’, ‘corridor’, ‘stairs’, etc.
Following are the main tasks involved in this process:
- Choosing a Building and Mapping Features
- Exporting Data to GeoJSON Format
- Importing GeoJSON to Google Maps
1. Choosing a Building and Mapping Features
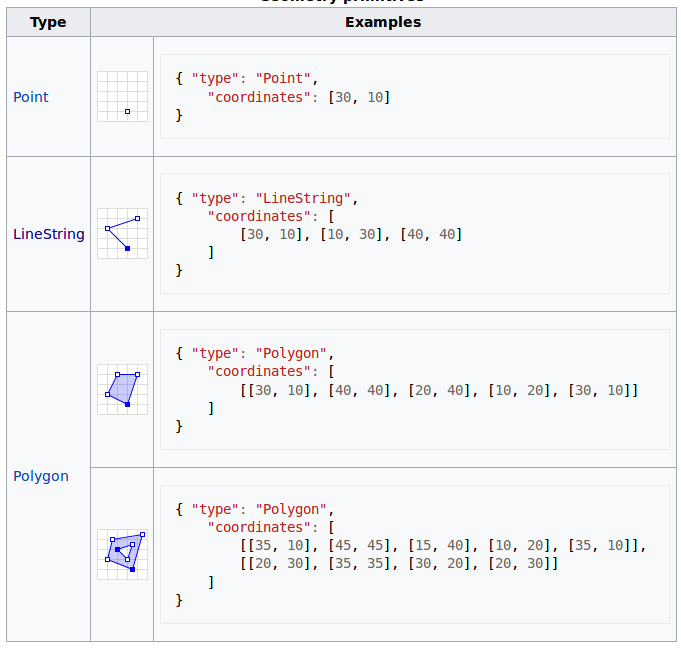
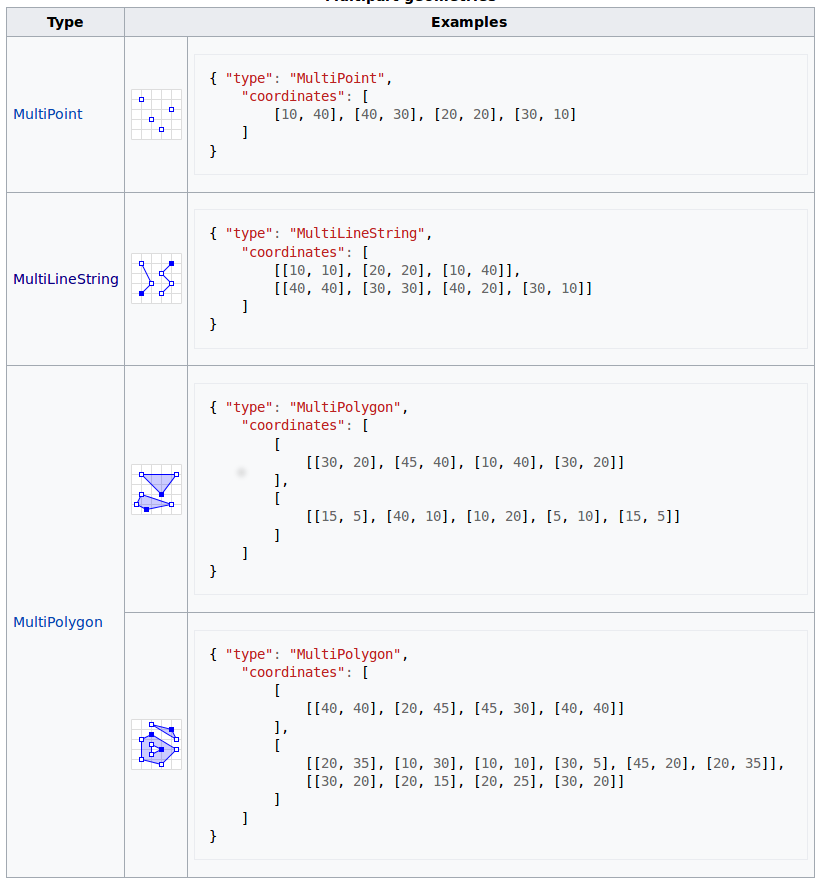
Here we choose our target building and then add indoor features to it. Every indoor elements such as “rooms” and “doors” must be mapped to one of the three geometry primitives – Point, LineString and Polygon or their “multipart” counterparts – MultiPoint, MultiLineString and MultiPolygon.
The geometry primitives, multipart geometries and the corresponding GeoJSON representation are depicted in following figures:
I used the software called JOSM Editor (Java OpenStreetMap Editor) for the mapping purpose. It is available for free here.In JOSM Editor, first we have to download the map data which encapsulate our building. For this, go to: File -> Download from OSM
Then draw a rectangle around the the building and click the “Download” button.
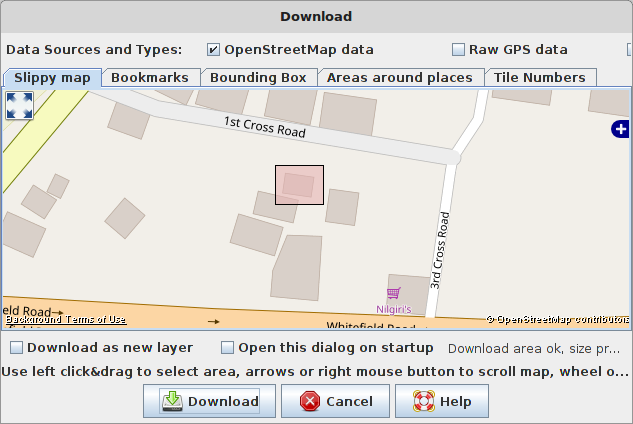 Doing so will open the selected area in the editor without the base map. Whatever drawing we perform in the editor is automatically geo-referenced. The only feature we have now in our editor is the Building. By selecting the building we can see the tag(s) attached to the building (building=yes).
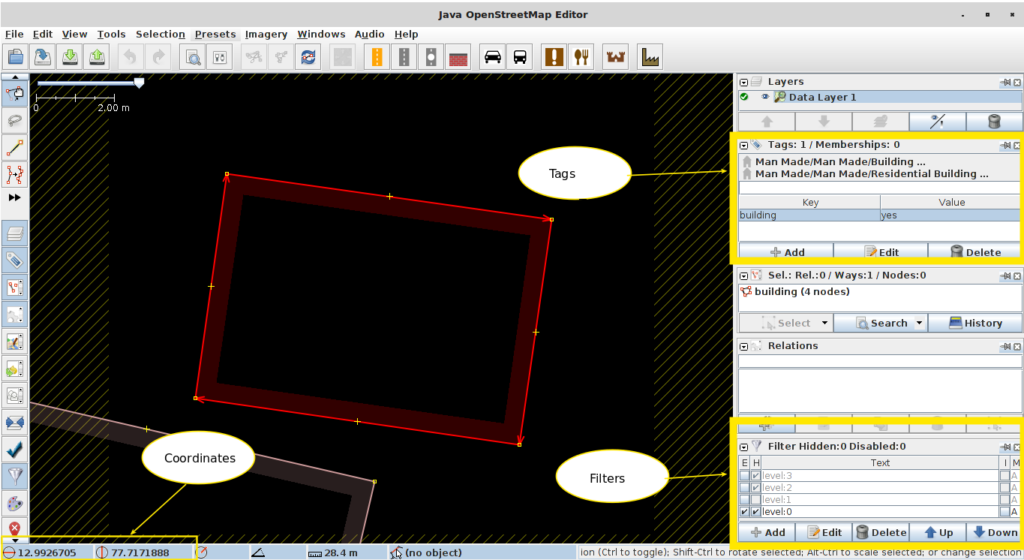 Tags are utmost important as they define the properties of the feature. We can use the “Draw nodes” tool to draw the indoor elements. I have mapped the following features in the map:
- Room
- Corridor
- Door
- Stair
I have used polygons to represent rooms and corridors and points to represent doors and stairs.
I have used the Simple Indoor Tagging Schema for tagging features. The tags used for each of these features are tabulated below:
| Feature | Tags | Example |
| Building | building=name_of_building levels=no_of_floors_available max_level=highest_floor/level min_level=lowest_floor/level ref=unique_identifier |
building=paying guest levels=2 max_level=1 min_level=0 ref=1 |
| Room | indoor=room level=the_floor_level_no ref=unique_identifier |
indoor=room level=0 ref=3 |
| Corridor | amenity=facility_available entrance=has_entrance_or_not indoor=corridor level=the_floor_level_no ref=unique_identifier |
amenity=bicycle_parking entrance=yes indoor=corridor level=0 ref=2 |
| Door | door=yes_or_no level=the_floor_level_no ref=unique_identifier |
door=yes level=0 ref=8 |
| Stair | indoor=room_or_area level=from_level_to_level ref=unique_identifier stairs=yes |
indoor=room level=0-1 ref=26 stairs=yes |
It is to be noted that all features in level 0 (floor 0) are tagged with level=0, and all features in level 1 with level=1. This is important as we use it in the GUI to switch between levels.
After mapping all the features in level 0, our map now look like this:
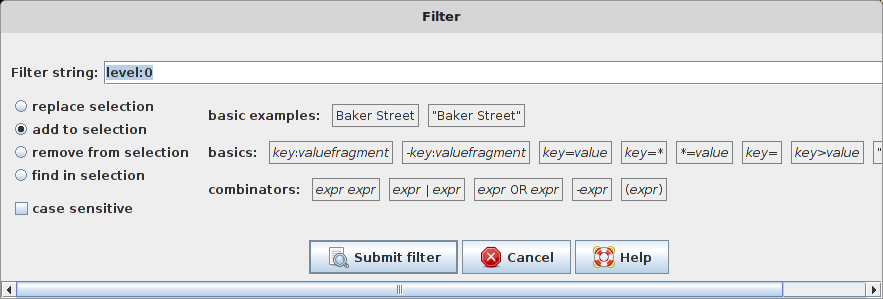
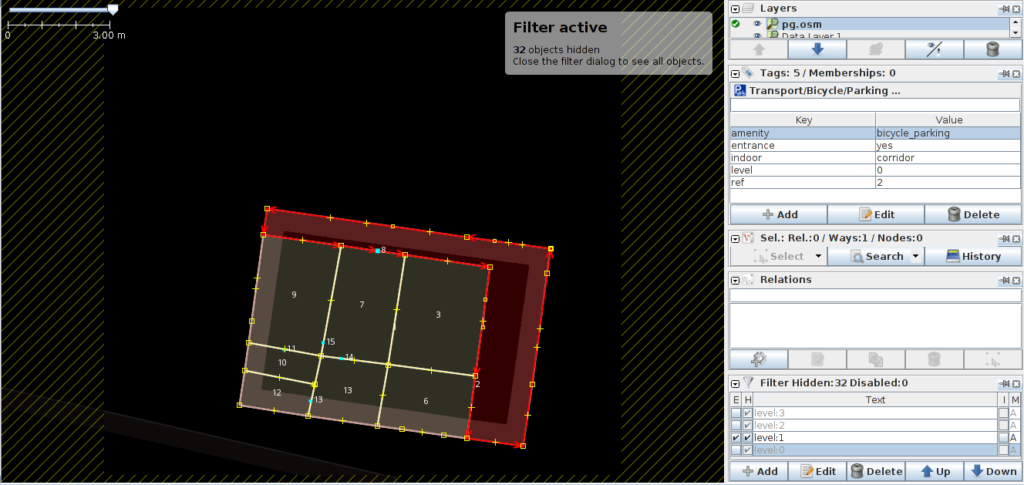 Now, we have to map the level 1. But, before start mapping, we have to hide the level 0 features to avoid confusion. Use the “Filters” to hide the level 0 features:
2. Exporting Data to GeoJSON Format
After mapping every features, save the file to GeoJSON file format.
Note: Drawing a closed structure (a room, for instance) is not sufficient for JOSM Editor to recognize it as a polygon. That means the created GeoJSON file will contain LineString instead of Polygon. But adding a buidling=name, or amenity=police tag will convert the closed line string to polygon. Later, we may delete those unwanted tags manually from GeoJSON. I am not quite sure if there is another standard way to solve this problem.
3. Importing GeoJSON to Google Maps
I have used the Google Map API’s Data Layer to import our GeoJSON data to the map.
The code to import the GeoJSON is as simple as this:
map.data.loadGeoJson('pg.json');
This will import the raw data (pg.json) as a layer to the map. We can further improve the look and feel of the features by adding styles as described here.
3.1 Adding Layer Switch Buttons to Map
So far we have just imported all of the data to the map, now to turn it into an indoor map, we have to show only the features of a single layer at any time. Obviously, we have to add button controls so that we can switch between the levels. Following is the function I created to generate a single button control for a level:
function LevelControl(controlDiv, map, targetLayerNo) {
  //clear current style
  map.data.setStyle({});
  // Set CSS for the control border.
  var controlUI = document.createElement('div');
  controlUI.style.backgroundColor = '#fff';
  controlUI.style.border = '2px solid #fff';
  controlUI.style.borderRadius = '3px';
  controlUI.style.boxShadow = '0 2px 6px rgba(0,0,0,.3)';
  controlUI.style.cursor = 'pointer';
  controlUI.style.marginRight = '10px';
  controlUI.style.textAlign = 'center';
  controlUI.title = 'Click to view Level ' + targetLayerNo;
  controlDiv.appendChild(controlUI);

  // Set CSS for the control interior.
  var controlText = document.createElement('div');
  controlText.style.color = 'rgb(25,25,25)';
  controlText.style.fontFamily = 'Roboto,Arial,sans-serif';
  controlText.style.fontSize = '16px';
  controlText.style.padding = '7px';
  controlText.innerHTML = targetLayerNo.toString();
  controlUI.appendChild(controlText);


  // Setup the click event listeners to change the level on map
  controlUI.addEventListener('click', function() {
    // this is the custom control in which the properties are appended
    var infoBar = document.getElementById('infoBar');
    // clear current contents
    infoBar.innerHTML = "";
    map.data.setStyle(function(feature) {
        // get level
        var level = feature.getProperty('level');
        var color = 'green';
        // all features of the input layer is made visible,
        // others hidden.
        var visibility = level == targetLayerNo ? true : false;
        return {
          icon: '/images/door.png',
          fillColor: color,
          strokeColor: color,
          strokeWeight: 1,
          visible: visibility
        };
    });
  });
}
In the initMap() function, we create two controls for level zero and level one respectively, and then add them to map.
// create a custom control for first layer switch button
var layerOneControlDiv = document.createElement('div');
var layerOneControl = new LevelControl(layerOneControlDiv, map, 0);

// custom control for second layer
var layerTwoControlDiv = document.createElement('div');
var layerTwoControl = new LevelControl(layerTwoControlDiv, map, 1);
// place the custom controls in map
map.controls[google.maps.ControlPosition.RIGHT_BOTTOM].push(layerOneControlDiv);
map.controls[google.maps.ControlPosition.RIGHT_BOTTOM].push(layerTwoControlDiv);
3.2 Adding Feature Info Bar to Map
I have created yet another control to display the tags attached to a feature whenever we click on it. The following function will create this control:
// to create a custom control for showing feature properties
function InfoControl(controlDiv, map) {
  // Set CSS for the control border.
  var controlUI = document.createElement('div');
  controlUI.style.backgroundColor = '#fff';
  controlUI.style.border = '2px solid #fff';
  controlUI.style.borderRadius = '3px';
  controlUI.style.boxShadow = '0 2px 6px rgba(0,0,0,.3)';
  controlUI.style.cursor = 'pointer';
  controlUI.style.marginBottom = '20px';
  controlUI.style.width = '200px';
  controlDiv.appendChild(controlUI);

  // Set CSS for the control interior.
  var controlText = document.createElement('div');
  controlText.style.color = 'rgb(25,25,25)';
  controlText.style.fontFamily = 'Roboto,Arial,sans-serif';
  controlText.style.fontSize = '16px';
  controlText.style.padding = '7px';
  controlText.id = 'infoBar';
  controlUI.appendChild(controlText);
}
As before, we have to add this control to map:
// custom control for showing feature properties/tags
var infoBarControlDiv = document.createElement('div');
var infoBarControl = new InfoControl(infoBarControlDiv, map);
// place the custom controls in map
map.controls[google.maps.ControlPosition.BOTTOM_CENTER].push(infoBarControlDiv);
Now the real challenge is to update our Info Bar dynamically on click of a feature. To do this, I have captured the onClick event of all features and did some simple coding to highlight the clicked feature and most importantly, get it’s tags and add them to Info Bar:
// event handlers for click function on features
map.data.addListener('click', function(event) {
  // this is the custom control in which the properties are appended
  var infoBar = document.getElementById('infoBar');
  // clear the current contents
  infoBar.innerHTML = "";
  // clear highlight from previously clicked feature
  map.data.revertStyle();
  // highlight the clicked feature
  map.data.overrideStyle(event.feature,
    {strokeWeight: 2, strokeColor: 'yellow', fillColor: 'yellow'});

  // loop through the properties of the feature
  event.feature.forEachProperty(function(value, name) {
    //append it to the infoBar
    infoBar.insertAdjacentHTML('afterbegin', "<strong>" + name + ": </strong>" + value + "<br>");
  })
});
That’s it!
Our simple indoor map is up and running:
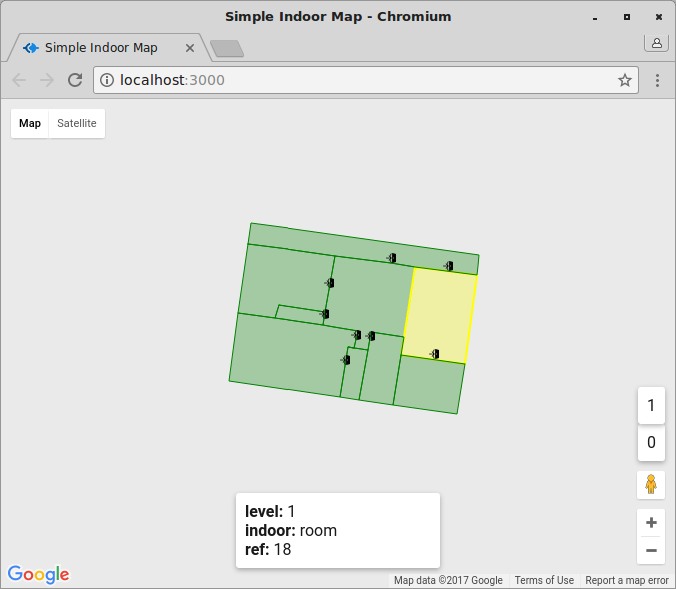 The complete code is available in my github repository here.

1 comment
[…] This post is a continuation of my previous post titled: Indoor Mapping with Google Maps API and GeoJSON. […]